Add-on of learNing AnaLYtics Support for open Edx (ANALYSE)


 Overview of ANALYSE

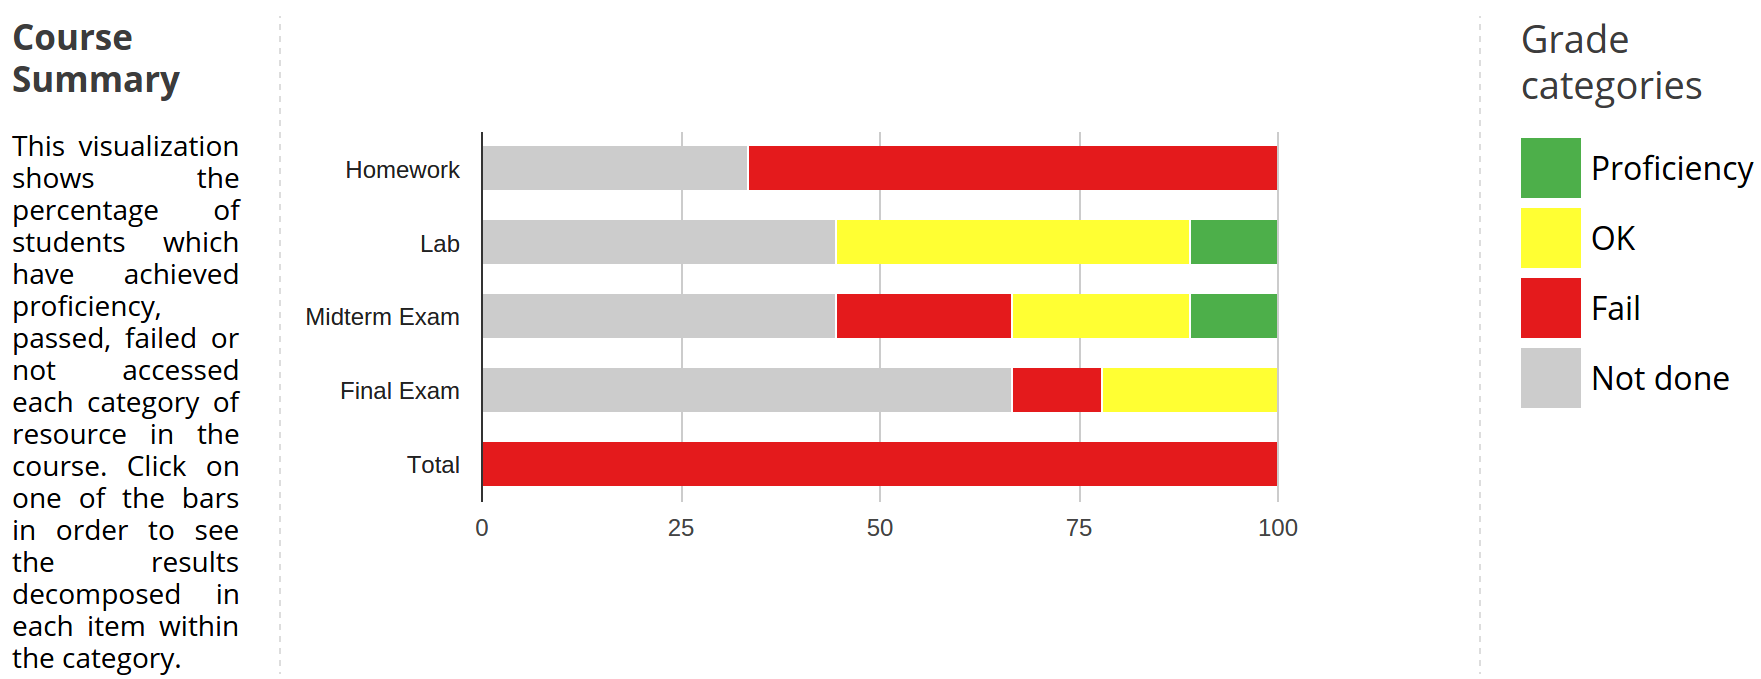
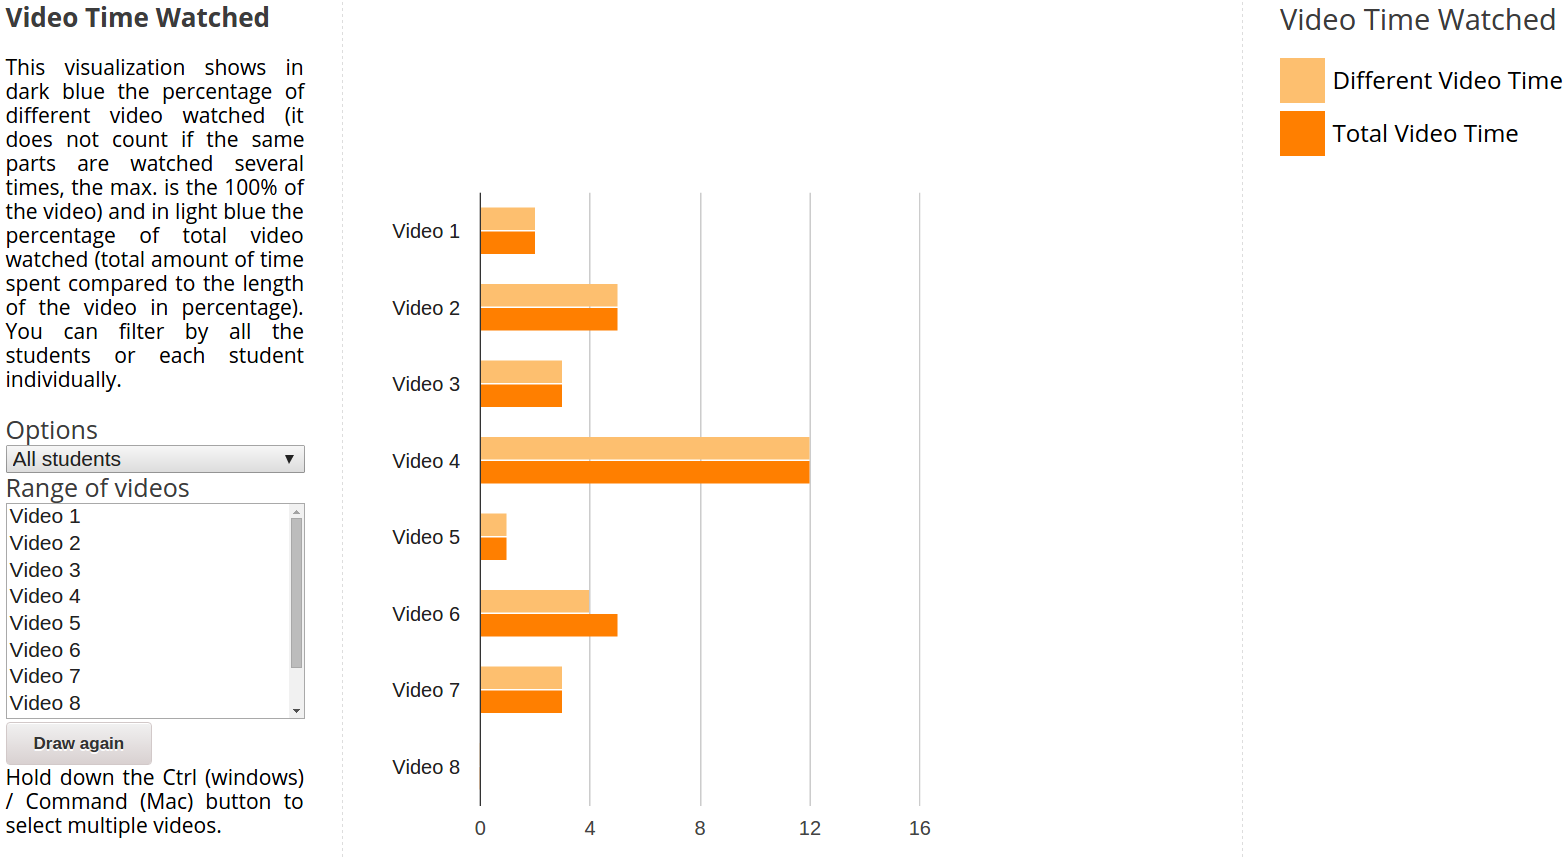
ANALYSE is a learning analytics tool developed for Open edX. ANALYSE transforms low level data into useful indicators about the learning process. In addition, ANALYSE provides useful visualizations for teachers and students using these indicators. At present, we provide a beta release of ANALYSE, which extends the learning analytics functionality of Open edX with 12 new visualizations. A new tab has been addded in the course dashboard of open edX to access ANALYSE. Some of the features of ANALYSE are the following:

  • Transform low level data from open edX logs into higher level indicators that are meaningful for the learning process
  • The learning analytics dashboard has 3 visualizations related to exercises, 4 related to videos and 5 related to general course activity
  • The instructors of a course can access the information about the aggregate of all students in a course an also each student individually. That allows instructor to keep track about how the whole course is progressing and control each student separately
  • The students in a course can only access their own information, which can be used for self-awareness and reflection on their learning process
  • The different indicators are processed in background in regular intervals of time as schedule jobs by the use of Celery Beat

 Videos of ANALYSE

The following videos show an overview of the ANALYSE functionality:

  • Video of ANALYSE (without subtitles, explanations of visualizations in English)
  • Video of ANALYSE (with subtitles in Spanish)


  •  Visualization examples

    In order to not be overwhelming with too much information we present only two examples of the visualizations provided by ANALYSE

    • The Course Summary visualization shows the percentage of students who have achieved proficiency, passed, failed or not accessed each category of resource in the course. Click on one of the bars in order to see the results decomposed in each item within the category.


    • The Video Time Watched visualization shows in dark blue the percentage of different video watched (it does not count if the same parts are watched several times, the max. is the 100% of the video) and in light blue the percentage of total video watched (total amount of time spent compared to the length of the video in percentage). You can filter by all the students or each student individually.
     Limitations of ANALYSE

    We want to strongly point out that the current release is a beta version of ANALYSE and it is not free of bugs and other problems. It has only been tested in experiences with few students and it will not probably scale well right now under massive environments. We are working towards fixing these issues. Therefore, it is distributed in the hope that it will be useful, but WITHOUT ANY WARRANTY.


     GitHub

    For the development we have used the "hotfix-2014-11-17" release of Open edX. The code of ANALYSE is available in the next GitHub url:

    https://github.com/analyseuc3m/ANALYSE

    It is licensed by the GNU AFFERO GENERAL PUBLIC LICENSE , which is the same of Open edX source code, with the next additional term:
    • Required to preserve the author attributions on the new added work for the development of ANALYSE

     Contributions are welcomed

    If you are interested in contributing to the development of ANALYSE we will be happy to help. For bug solving changes feel free to send a pull request in the GitHub repository. In case you would like to make a major change or to develop new functionality, please contact before starting your development, so that we can find the best way to make it work.


     Future Work

    We are already developing new features for ANALYSE and the project is still on alive. Some of the new lines that are being followed are the following:

    • Improvement of the design and performance of the analytics functions to process the indicators
    • New indicators related to efficiency, effectiveness or the behavior of students while solving problems, and more
    • Re-design of some of the current visualizations for new ones that are more understanble and transmit the information in a clearer and more efficient way
    • Bug solving
     Developed by

    ANALYSE has been developed in the Gradient lab, which is the e-learning laboratory inside the GAST group, as a part of the Department of Telematic Engineering, at the University Carlos III of Madrid (Spain). The main people involved in the design and implementation of this tool have been the following:

    • José Antonio Gascón Pinedo - Universidad Carlos III de Madrid - jgascon@pa.uc3m.es
    • José Antonio Ruipérez Valiente - IMDEA Networks Institute and Universidad Carlos III de Madrid- jruipere@it.uc3m.es
    • Pedro Jose Muñoz Merino - Universidad Carlos III de Madrid - pedmume@it.uc3m.es
    • Héctor Javier Pijeira Díaz - Universidad Carlos III de Madrid (by implementing his Final Year Project)
    • Javier Santofimia Ruiz - Universidad Carlos III de Madrid (by implementing his Final Year Project)
    • Carlos Delgado Kloos - Universidad Carlos III de Madrid

    Acknowledgements. This work has been supported by:

    • The "eMadrid" project (Regional Government of Madrid) under grant S2013/ICE-2715
    • The RESET project (Ministry of Economy and Competiveness) under grant TIN2014-53199-C3-1-R