Detecting memory leaks and debugging
Previous activities
Table of Contents
1. Using the debugger
Readings
Resources
-
File
gdb_use.cin subfolderDebuggerin your shared folder. Available .
Work Plan
Read the document offered in the Resources section about the debugger. Make a list of the debugger commands in a sheet of paper. This sheet will be very useful to you throughout the course.
Make sure you are capable of:
-
Stop a program at any location in the code.
-
You know how to use the functions “Next ” and “Step”.
-
Set a condition on a break point and verify that the program stops only if the condition is true.
2. Valgrind, memory leak detection
Resources
-
Valgrind quick start guide (sections 1,2,3,4,5 and 6).
-
Folder with name
Valgrind_firstand filetesting_valgrind.cin the shared folder Subversion. There is a local copy here
Work Plan
We are going to use the tool Valgrind to detect memory leaks. Valgrind is in fact a framework with a set of tools such as Memcheck (the one we are going to focus on), which allows you to execute a C program and see if any line of your code produces a memory leak or any other memory-related error.
-
Read the quick start guide offered as resource.
-
Open a command terminal and compile and execute the program
testing_valgrind.cthat you will find in theValgrind_firstfolder in your shared space. Execute again the program using Valgrind and analyze the report bout the memory usage that is printed. -
Modify the program
testing_valgrind.csuch that when executing with Valgring, no error is shown. Upload the new version of the file to the repository with Subversion.
3. Errors detected by Valgrind
Resources
-
Types of problems detected by Memcheck in Valgrind (Section 4.1. of the user manual).
-
Explanation of the error messages produced by Memcheck (Section 4.2. of the user manual).
Work Plan
We are going to work more in depth with the different types of error that Valgrind detects, and more specifically with the tool Memcheck.
-
Read the error types detected by Memcheck, using the document shown above. Ignore the error “Mismatched use of malloc/new/new [] vs free/delete/delete []”, because only appears in programs written in C++.
-
Read the error messages that can be obtained executing your program with Valgrind, using the second resource above.
-
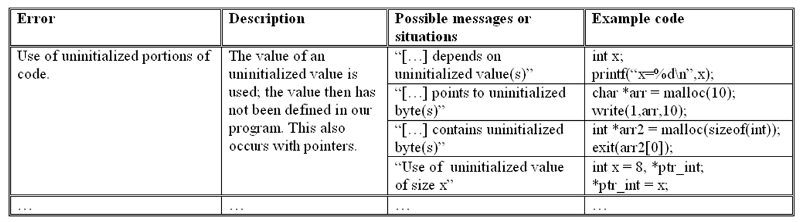
When finished the task above, write individually a summary (1 side of a sheet), displayed in a table, in such a way it includes the error type, a brief description (couple of lines) of why the error can appear, the possible messages Valgrind can print out, and a hypothetical code as an example. You can see an example in the following figure:
Write the table in horizontal orientation, to see it better. Note that one type of error can have more than one associated message, as the one of the figure, but different types of errors can have associated the same error message (as the errors that imply an invalid write or read). If you don't know how to fill a row or column, leave it blank. You will be able to fill it while you work with Valgrind.