| Chapter 16. The Debugger | ||
|---|---|---|
 | Part II. Tools |  |
| Chapter 16. The Debugger | ||
|---|---|---|
| | Part II. Tools | |
Table of Contents
One of the main problems when developing applications is execution errors. Compiling a program is not enough to guarantee that it works as it is supposed. Even worse, a significant part of the developing cycle of a program is devoted to detecting and fixing execution errors. These errors in programs are usually known as "bugs".
The origin of the term "bug" to describe mistakes in a program is a bit confusing, but there are two documented references that seem to provide a reliable source.
The first one is found in a letter that Edison wrote in 1878 in which it can be read:
It has been just so in all of my inventions. The first step is an intuition, and comes with a burst, then difficulties arise -- this thing gives out and [it is] then that “Bugs” -- as such little faults and difficulties are called -- show themselves and months of intense watching, study and labor are requisite before commercial success or failure is certainly reached.
Source: Edison to Puskas, November 13th, 1878, Edison papers, Edison National Laboratory, U.S. National Park Service, West Orange, N.J., also cited in “Thomas P. Hughes, American Genesis: A History of the American Genius for Invention”, Penguin Books, 1989, page 75.
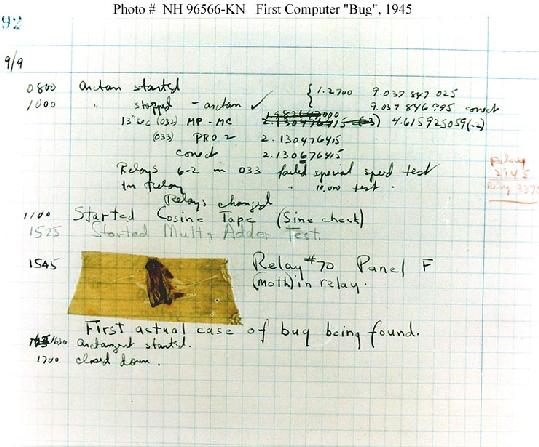
The invention of the term is generally attributed to the engineer Grace Hopper who in 1946 was a member of the computing laboratory at Harvard University working in two computers with names Mark II and Mark III. The operators discovered that the cause of an error previously detected in Mark II was a moth that was stuck among the pins of a relay (by then the basic element in a computer) itself part of the computer logic. These operators were familiar with the term "bug" and even pasted it into a logbook with the annotation “First actual case of bug being found” as it can be seen in the following figure (Source: U.S. Naval Historical Center Photograph).
Nowadays, there are several methods used to
“debug” errors in a program, each of them with different
effectiveness. Inserting printf statements that write messages to
the screen is probably the most inefficient of them all. In fact, what is
required is a tool that allows the execution of a program in a controlled
environment, that allows an execution to be temporarily suspended at any point
in the an be able to check any value or variable that takes part on that
execution.
This tool is known with the name of debugger and it is an executable that allows the execution of a program in a controlled environment. It behaves as a wrapper inside of which a program execution takes place but allows to perform a set of specific operations to visualize the execution environment at any point in time.
More precisely, the debugger allows:
program execution one line at a time
temporarily stop an execution in a given code line
temporarily stop an execution under specific conditions
visualize the contents of all used variables at a given point in the execution
change the values present in the execution environment and see the effect of such changes with respect to the program
One of the most popular debuggers in Linux environments is
gdb (Gnu Debugger). In this document,
the most relevant commands for this debugger are described to be used in a C
program. All examples in the remaining of this document are presented with
respect to the following source code (contained in the file
gdb_use.c).
1 2 3 4 5 6 7 8 9 10 11 12 13 14 15 16 17 18 19 20 21 22 23 24 25 26 27 28 29 30 31 32 33 34 35 36 37 38 39 40 41 42 43 44 45 46 47 48 49 50 | #include <stdio.h>
#include <stdlib.h>
#define SIZE 1000
struct data_unit
{
int data;
struct data_unit *next;
};
typedef struct data_unit unit, *unit_ptr;
void function(unit_ptr table)
{
int y;
for (y = 0; y < SIZE - 1; y++)
{
table[y].data = y;
table[y].next = &table[y + 1];
}
table[SIZE - 1].data = SIZE - 1;
}
int check(unit_ptr table)
{
int y;
for (y = 0; y < SIZE; y++)
{
if ((table[y].data + 1) != table[y].next->data)
{
return 1;
}
}
return 0;
}
int main(int argc, char **argv)
{
unit_ptr buf;
buf = (unit_ptr)calloc(SIZE, sizeof(unit_ptr));
function(buf);
if (check(buf))
{
printf("Error detectado en tabla\n");
}
free(buf);
return 0;
}
|
In order for gdb to be able to manipulate a C program, it must be compiled with a specific option that produces an executable including additional data for such task. This is done by including option -g when invoking the compiler:
$ gcc -Wall -g -o gdb_use gdb_use.c
Once the executable has been created, the debugger is started with the command:
$ gdb gdb_use
Once the debugger has started, a message is shown on the screen followed by the prompt (gdb)
$ gdb gdb_use
GNU gdb (GDB) 7.0-ubuntu
Copyright (C) 2009 Free Software Foundation, Inc.
License GPLv3+: GNU GPL version 3 or later <http://gnu.org/licenses/gpl.html>
This is free software: you are free to change and redistribute it.
There is NO WARRANTY, to the extent permitted by law.  Type "show copying"
and "show warranty" for details.
This GDB was configured as "i486-linux-gnu".
For bug reporting instructions, please see:
<http://www.gnu.org/software/gdb/bugs/>...
Reading symbols from /home/test/gdb_use...done.
(gdb)
At this point, the debugger has started executing, but the program gdb_use (given as first parameter) has not. The interaction with the debugger is done through different commands typed at the prompt, much the same was as the interaction with a shell in Linux.
The program execution is started by the command run (or its abbreviation r). Once typed, execution starts normally as if the debugger was not present. If an error or an interruption appears, the execution stops but control is returned to the debugger and the same prompt (gdb) in shown again on the screen. For example:
(gdb) r
Starting program: /home/test/gdb_use

Program received signal SIGSEGV, Segmentation fault.
0x08048441 in check (table=0x804a008) at gdb_use.c:29
29          if ((table[y].data + 1) != table[y].next->data)
(gdb)
Whenever there is an error, the debugger shows the exact location in the code responsible of such error. It is possible that such location is in an internal system function. What this means is not that the error is in the library, but due to some malfunction in the given code, the system library had an erroneous execution.
Program execution can be arbitrarily stopped while executing by simply pressing Crtl-C (pressing the control key and, while doing that, pressing C). The interruption is caught by the debugger which takes control and shows the command interpreter. At this point, program execution has been stopped but not finished. In fact, execution can be continued by using the continue command (abbreviated simply as c).
To finish a debugging session, the command quit (or simply letter q) is used. If the session is terminated while a program is being executed, the debugger asks for confirmation before terminating both of them.
(gdb) q
The program is running.  Exit anyway? (y or n) y
$
The help command shows information related to all available commands and their options. If invoked with no arguments, a set of categories in which commands are divided is shown. If a category name is given as parameter, information about all commands within such category is shown. If invoked with a command as argument, a detailed description of the options is shown.
| |  | |
| 15.12. Activities |  | 16.2. The Stack Trace |